7.19.10
Invertebrate Anatomy
To reacquaint ourselves with invertebrate anatomy, the class dissected a wide array of invertebrates. Lisa and I dissected a sea cucumber.
Phlylum Echinodermata
Class Holothuroidea
Parastichopus californicus
- First we identified the conspicuous external characteristics:
- Mouth with buccal podia
- Anus
- 5 rows of tube feet
- Ossicles
- The cucumber was surprisingly docile after incubation in MgCl2. We made a longitudinal cut from the anus to the mouth along the right dorsal interambulacrum. The rubbery skin (dermis) of the sea cucumber was surprising difficult to cut. While cutting, the cucumber eviscerated its internal organs via the anus. We identified the internal organs:
- Gut
- Respiratory trees
- Longitudal muscle bundles
- Calcareous ring
- Polian vessicle (part of WVS, opening from ring canal, fluid storage?)
- Our cucumber did not have gonads, possibly too young?
- We then took a tour of the lab, looking at dissections completed by the other students which included:
- another sea cucumber with tons of gonads
- oyster
- snail
- clam
- geoduck
- sea star
- urchin
- I then decided to try my luck with dissecting an anemone, but this was anticlimactic, as the MgCl2 hadn't really taken and the anemone contracted. While cutting, however, the anemone released numerous acontia, so I mounted one on a slide and added bleach to fire the nematocysts.
7.20.10
Histology
Today Carolyn gave us an intro histology lecture. For our first lab, we looked at slides of healthy shellfish to try to identify tissues/organs that were shown to us in lecture. I looked at abalones slides and was able to identify the following features:
- gill (frilly and convoluted, bluish in color with lots of hemocytes)
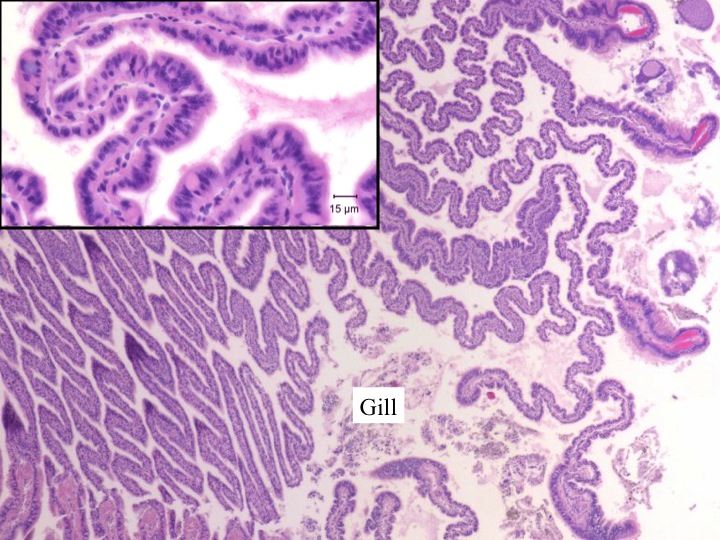
- hypobranchial gland (mucus secretion; large and curvy and faded blue-jean in color)

- rectum (flower-like)

- hemocytes (tiny, round, blue)
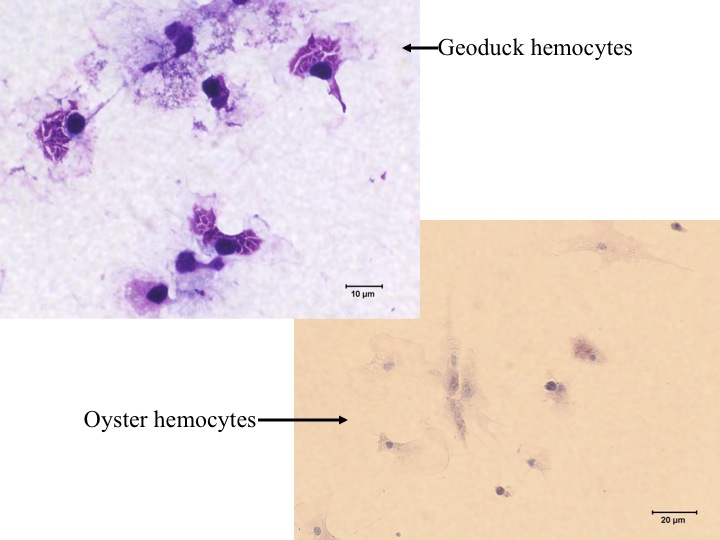
- right kidney (nitrogen excretion; pink with lots of hemocytes)
- heart (also very pink with lots of hemocytes, but muscle striations are distinctive)

- intestine (batman)

- foot muscle (lots of pink and nothing else with distinctive muscle striations)

Littorine Trematodes
This morning we collected littorines at Cattle point for dissection. Cattle Point has high gull abundances, and because of this, higher parasite abundances. Gulls are the final host for the adult trematode. Parasite eggs are release from the bird via the feces, and the eggs hatch into miracidia in the water. The miracidia are ingested by the snails (primary intermediate host) were they develop into radia (saclike with pharynx and a gut) in the digestive gland. The radia can then develop into either sporocysts (sack-like without pharynx and gut) or cercariae. The cercariae emerge from the snail and can then penetrate fish tissue (second intermediate host), the fish in turn being eaten by the birds, and the life cycle is completed.
We collected potentially three species of littorines:
- Littorina sitkana (larger and compressed with stipes)
- L. scutulata or L. plena (smaller and longer with checkboard)
- Side by side for scale.
You can't tell L. scutulata from L. plena in the field, but have to look at the patterns of pigment on the head. One had tiger stripes and one had vertical stripes, but we're not sure which is which at this point.
In order to determine infection status, the digestive gland of the snail must be dissected. When you cut into the gland, you can see hundreds of wiggling cercariae emerge in an infected snail. Besides determining infection status, we also wanted to collect RNA to compare gene expression of snails with and without parasites, and we wanted to collected DNA to look at microbial communities between the two infection states. This was the protocol:
- crack shell with vice grips
- remove snail from shell
- remove digestive gland from rest of body
- remove operculum from foot
- remove head
- cut off a small piece of the foot for DNA extractions (freezer; colored tubes)
- save the rest of the body for RNA extractions (dry ice in freezer; blue, individually wrapped tubes)
- cut into digestive gland and look for cercariae
- disinfect tools with bleach in between dissections to avoid contamination
I dissected 5 snails, three L. sitkana without cercariae, one L. sitkana with cercariae, and one L. scutulata/L. perla with cercariae. Although I'm not sure what species of trematode were infecting my snails, the two infected snails I dissected had different species of trematodes (as the morphology of the circariae was different). Perhaps there are species-specific infections?
A B
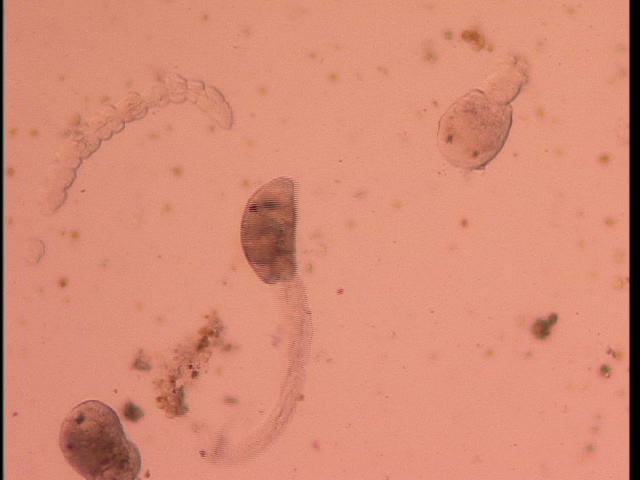
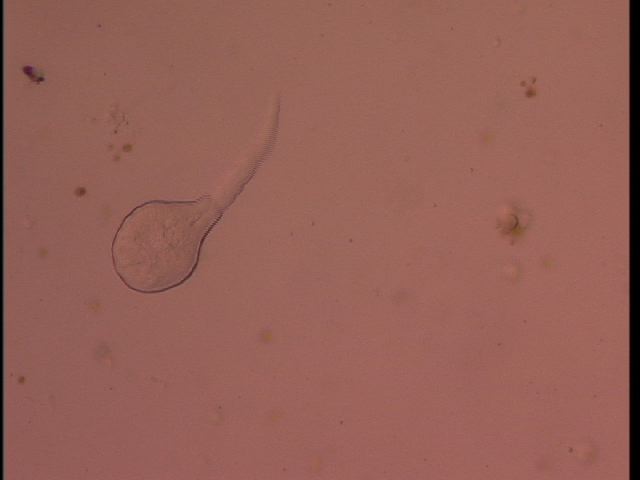
Circaria from L. scutulata (A) and L. sitkana (B).
7.21.10
Nudibranch diagnostics
Subtidal nudibranchs (Armina sp.) were collected for the neuroethlogy class. Unfortuately, or fortunately for us, the nudibranchs have been developing lesions and then quickly die there after. The lesions are characterized by interuptions of their normal stripe pattern. They have also been exhibiting unusual behavior, laying on their backs.
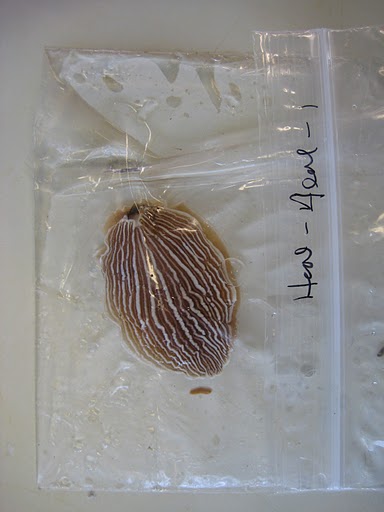 |
| Healthy Armina |
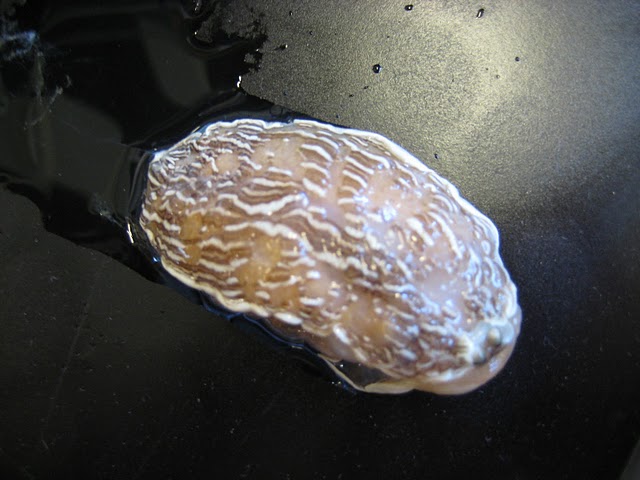
Healthy nudibranch Nudibranch with lesions (disruption of stripes)
Today we wanted to do some preliminary diagnostics of the lesions. We swabbed the leading edge of the lesions, healthy tissue of nudibranchs with lesions, and healthy tissue of healthy nudibranchs. We also did tissue presses and dissections.
Plate streaking
Using the swabs, we plated the bacteria on marine agar and TCBS (Thiolsulfate citrate bile sucrose salt) plates to try to isolate culturable members of the normal and lesion tissue microbial communities. TCBS plates are selective for Vibrio, and they also give information concerning biochemical capabilities of the Vibro that grown on them. Colonies that turn yellow are able to ferment sucrose, while colonies that turn green can not. Lisa and I swabbed a healthy nudibranch. We each took three swabs from varying locations on the back of the nudibranch. Lisa streaked TCBS plates, and I streaked marine agar plates. We did the four quadrant method, where you streak into four separate quadrants to try to isolate individual colonies. We swabbed the nudibranch with a sterile cotton applicator, and streaked with a plastic loop that was disinfected with bleach and rinsed with water in between quadrants. The plates were kept upright on the bench until they were dry, and then they were wrapped in parafilm and flipped.
Tissue presses
Tissue was scraped from healthy tissue, lesion tissue, and healthy tissue of nudibranchs with lesions. The tissue was wiped onto a slide. Tissue scrapes of lesions had paramecia present, while healthy tissue, both from completely healthy nudibranchs and from nudibranchs with lesions, did not have the paramecia. Carolyn said that is it common for paramecia to recruit to areas of tissue necrosis. Therefore, the presence of these microorganisms does not imply that they are the cause, but could rather be an effect of degrading tissue.
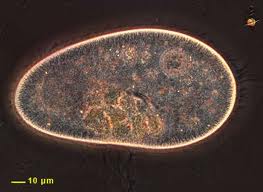
The paramecium looked similar to this, but was more tapered on the anterior end .
Gram Stains
Gram stains were then performed on the tissue scrapes using the following protocol:
- sample is heat fixed by running the slide briefly over an open flame
- crystal violet is placed on the slide for ~1 min and is then rinsed off gently with water
- gram iodine for ~ 1 min and is then rinsed off
- The stain is then decolorized by adding decolorization solution (alcohol and/or acetone or both), then rinsing, repeating this cycle 3 times. It is better to under decolorize than to over decolorize
- Safranin is added for 20 seconds and is then rinsed
- Slides are blotted gently and allowed to dry
- Use 100X objective with oil
Crystal violet can enter the cell wall and membrane of both gram negative and gram positive cells. However, gram negative cells have a thin peptidoglycan layer, and the stain is able to leave the cell during the decolorization process. Gram positive cells have a much thicker peptidoglycan layer and the stain remains fixed. Therefore, gram positive cells stain purple. Safranin is added at the end to stain the gram negative cells pink, since they loose their color during the decolorization phase.
Under the scope, there appear to be many gram negative cells associated with both healthy and lesion tissue. To the untrained eye (i.e. mine), it is difficult to ascertain bacteria shape, even using the 100X objective. There are some tiny gram positive bacteria present as well. The ciliates also stain purple, but are much larger than bacteria and are thus easy to identify.
DNA extractions of snail foot
Today we extracted DNA from the snail foot dissected yesterday. The DNA sample should contain snail DNA, as well as any DNA from the snail microbial community. Extractions were performed using the QIAamp DNA Stool kit according to manufacturer's instructions, except only half of an enzyme tablet was added, 100 ul of AE was used to elute the DNA, and the AE was allowed to incubate on the membrane for 5 minutes prior to the final spin. The stool kit is used to eliminate compounds, like pigments, that may inhibit downstream reactions (e.g. PCR). I extracted DNA from a L. sitkana snail that was infected with parasites. I also performed a blank extraction to determine if contamination has occurred during the extraction process.
PCR of DNA using universal bacterial primers
In order to test our DNA extractions, a PCR was set up (by Carrie) using universal bacterial primers.
Master Mix
Component 1 Rxn(ul) 35 Rxn(ul)(14 samples in duplicate plus 3 negative controls plus 10%)
2X Promega GoTaq mix 12.5 437.5
100X BSA 1.5 52. 5
10uM F primer 1 35
10uM R primer 1 35
water 7 245
template 2
total 25
Program
1. 95 for 10 min
2. 95 for 30 s
3. 55 for 30 s
4. 72 for 50 s
5. Repeat steps 2-4 40 times
6. 72 for 8 min
7. 4 forever
7.22.10
Nudibranch swabs
We checked our streak plates to see what had grown. For our healthy nudibrach, we were unable to isolate any Vibrio bacteria using TCBS. All three of the marine agar plates displayed growth, but for two of the plates, the streaking did not isolate individual colonies, and all of the growth remained in the 1st quadrant. The bacteria grew as a white film covering the quadrant in the swabbing pattern. For the third plate, only ~5 colonies grew. They colonies are about 1.5 mm in diameter and are white. Intrestingly, Vibrios were isolated from most of the swabs of nudibranchs with lesions, while no Vibrios were isolated from swabs of the healthy nudibranchs. Vibrio from swabs of healthy tissue from nudibranchs with lesions were also isolated. One group with a nudibranch with lesions was unable to isolate any Vibrios, but this group had a nudibranch with only a single lesion that was very subtle. As Vibrio are commonly opportunistic, k-slected microrganisms, its possible they are congregating to the site of infection, taking advantage of the nutrients released via necrotic tissue.
Marine agar TCBS (no growth)
Eel grass microbe isolation
We wanted to try to isolate the labyarinthulid that has been previously found to infect eel grass (Zostera marina). This morning we took a boat to Picnic Cove with Sandy and his crew to collect sea grass and other invertebrates that could potentially be infected at the site. We collected sea grass with lesions potentially caused by the laby, as well as healthy pieces of sea grass. We also collected crabs, as there were many dead crabs at the site, ad we collected a few cockles.
Back in the lab, we tried a variety of techniques to isolated the laby, as well as the microbes associated with the sea grass. Kathy and I cut up small pieces of healthy and 'diseased' sea grass and plated them on marine agar and TCBS plates. We did a single plate of each variety per treatment, dividing the plate into 8 quadrants and placing 8 small pieces of sea grass on the plate, one in each quadrant. This will probably not enable the laby growth, but rather surface bacterial growth.
Sarah and Tiffany also tried to culture the laby via a few approaches. First they simple cut up healthy and 'diseased' pieces of sea grass and put them in 6-well plates with QPX growth media. They also surface sterilized the sea grass before cutting it up and putting it in the media via the following procedure:
- Rinse in betadine
- Used a razor bladed to scrape the surface
- Rinsed in sterilize seawater
- cut up into small pieces and place in media
RNA extractions
We extracted RNA from litterines of both species that were both infected and not infected with parasites according to the following protocol:
- Defrost tissue on ice and mince tissue with a sterile razor blade
- Add 300 ul of Tri-Reagent and homogenize with a pestles. Add 700 ul more of the Tri-reagent for a total of 1 ml (per 50-100 mg of tissue).
- Vortex for 15 seconds and let sit at rm temp for 5 min.
- Add 200 ul of chloroform, vortex for 20 sec, and let sit at rm temp for 15 min.
- Spin (12,000 g) at 4 degrees for 15 min.
- Add 500 ul isopropanol.
- Let sit at room temp for 15 min.
- Spin (12,000 g) for 8 min at 4 degrees.
- Remove isopropanol
- Wash with 1 ml 75% EtOH
- Centrifuge for 5 min at 7500g (between 4-25 degrees)
- Remove as much EtOH as possible and let pellet airdry for 5-10 min.
- Dissolve in 50 ul of nuclease-free water and incubate at 55-60 for 10 min.
We were unable to determine the concentration and purity of RNA using a spectrophotometer because the spec we had seem to not be functioning properly.
Gel
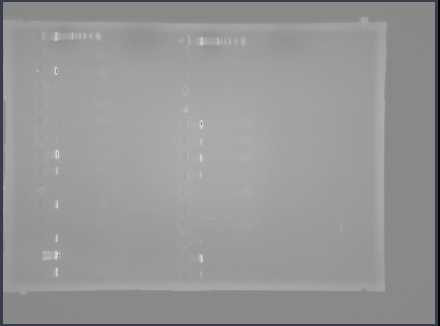
Lisa was nice enough to make and run a gel for our PCR using universal bacterial primers. Here is the gel:
The good news is that we got amplification. The bad news is that there was amplification in both our extraction negative control and our no template negative control. From this gel, its difficult to tell where the contamination is occurring. To test this, I would first re-run a PCR with a new master mix made in the molecular lab with all new components. If the no template control had no amplification, but the extraction control did, then we would have to repeat the DNA extractions again. If both the no template control and the extraction control was clear, then we would know that the contamination was in the original master mix, and we'd be good to go. However, given that we were using universal bacterial primers, its not surprising we got amplification, especially given that we were working in a wet lab. Usually when I try to amplify bacteria, I do both the DNA extractions and the PCR in a sterile hood.
7.22.10
Reverse Transcription
We performed an RT reaction according to the following protocol:
- Put 17.75 ul of RNA in a sterile tube and incubate at 70 degrees for 5 minutes.
- Place on ice up to 10 minutes
- Add 7.25 ul of Master Mix:
- 5x MMLV buffer 5 ul
- 10mM dNTPs 1.25 ul
- MMLV RTase 0.5 ul
- Oligo dT primer 0.5 ul
- Incubate at 42 degrees for 1 hour.
- Incubate at 95 degrees for 3 minutes.
7.23.10
Eel grass plates
Today we viewed the plates that Kathy and I made yesterday. On the marine agar, interestingly, the plates that had pieces of sea grass with lesions had bacterial films that had developed surrounding the pieces of sea grass. Little or no bacterial growth occurred around the healthy pieces. On the TCBS, the same pattern occurred, although it is unclear whether the film surrounding the pieces with lesions are actually bacteria growth or pigmentation. Once again, this bacterial growth most likely represents a secondary infection brought about by tissue necrosis. Kathy streaked some of the bacterial growth on other plates to try to isolate colonies. She dived the plate into 4 quadrants, and streaked bacterial growth from four different pieces of Eel grass, one in each quadrat.
eel grass with (left) and without (right) lesions on marine agar and TCBS
Tritonium lesions
The Tritonium used by the neuroethology class have also been developing lesions. The cause of these lesions are a laby related to the kitrid fungus association with amphibians. Carolyn tried to isolate the laby by cutting up pieces of tissue and culturing them in QPX. Tissue was also collected for histology. Drew is hoping we can culture the laby and then compare the laby from the sea slug to the sea fan laby and the kitrid fungus to see if they are closely related.
Tritonium with no head. The nudibranch contracted so the lesions are not apparent.
qPCR
Today we also ran a qPCR on the cDNA from the littorines. We used two sets of primers: actin as the reference gene, and jun-c as the gene of interest. The reference gene is used to normalize the results of the qPCR to adjust for pipetting error, differences in efficiency in the RT reaction, machine limitations, etc. Our gene of interest, jun c (c-jun N-terminal kinase, JNK), is a MAP (mitogen-activated protein) kinase. MAP kinases are responsive to stress stimuli (i.e. cytokines, heat shock, osmotic shock, etc.) and are involved in apoptosis in invertebrates. JNK MAPKs are critical mediators of signal transduction for a number of pathways relating to immunity, development, and stress. JNK has been shown to be activated via lipopolysaccharide (LPS). On the other hand, parasites (Leishmania) are able to evade the activation of JNK kinases in macrophages, thereby evading the innate immune response. This is a common strategy of parasites, so it is possible that c-jun may be down-regulated in infected snails. However, it is also possible that c-jun could be up-regulated in infected snails, thereby triggering a series of cascades that ultimately lead to the transcription of immune effectors.
We performed the qPCR according to the following protocol:
- Master Mix (made two separate master mixes, one for each primer set). We made enough MM for 5 reactions, enough to run our cDNA in duplicate, run a negative control in duplicate, plus extra for pipetting error).
Component 1 Rxn (ul) 5 rxns (ul)
2X SYBr Mix 12.5 62.5
BSA 1.5 7.5
F primer 0.5 2.5
R primer 0.5 2.5
Water 8 40
Total 23 Template 2
- Thermal profile:
2. 95 for 0:10
3. 60 for 0:30
4. 72 for 0:30
5. Repeat 2-4 40 times
6. Melting curve
a. 95 for 1:00
b. 55 for 0:30
c. 95 for 0:30
Nudibranch (Armina) swab gram stains
While waiting to load the qPCR plate, I decided to try my luck at gram staining the bacteria cultures that grew from the surface swabs of the nudibranch. I added a small volume of water to a slide and then used a sterile wand to added some bacteria to the water. I then performed the gram stain as previously mentioned. I did this for the three separate marine agar plates that displayed growth, representing three separate swabs of a single, healthy nudibranch. I then viewed the slides under the phase contrast scope using the 100X objective and oil. For some reason I can't get the pictures to upload properly, but all three slides were dominated by gram negative rods.
7.24.10
qPCR analysis
Today we went over the results of our qPCR plate. Very few samples had no amplification in the no template control, suggesting a great deal of contamination. There were some negative controls, however, without contamination, suggesting that it may not have been the master mix or other components used by all members of the class (i.e. water, primers, BSA). Instead, contamination may have occurred when loading the plate, as it was uncovered for an extended period of time. Additionally, not all cDNA samples showed amplification. This could be for a number of reason, including not have detectable amount of the gene within the cDNA, forgetting to add a component to the master mix, or forgetting to add template. Over all, there were so many variables that contributed to amplification where it shouldn't be, or lack of amplification where it should be, that its difficult to interpret the results. However, this was a good exercise to review all of the potential issues that can arise in qPCR.
We did seem to see a few different melting curves (i.e greater than 2), suggesting amplification of unwanted products. Melting curves are essential when using SYBR to determine if you have non-specific binding. At a specific high temperature, the dsDNA product will "melt" or disassociate, and this temp is dependent upon product size and GC content. For a single primer pair, you only want a single peak, representing the melting of a single product. Multiple peaks suggest multiple products and therefore, non-specific binding. The melting temperatures were high, suggesting that primer dimers were not the issue. Our melting temp for actin appear to be at around 86 degrees, while the melting temp for c-jun was about 81 degrees. However, we were consistantly seeing a product melting at about 80 degrees in many actin negative controls. Therefore, we do have non-specific binding, but why it is only occurring in our negative controls is difficult to ascertain. Is it possible that it is also occurring in the template samples, but that the signal is being swamped by the actual product?
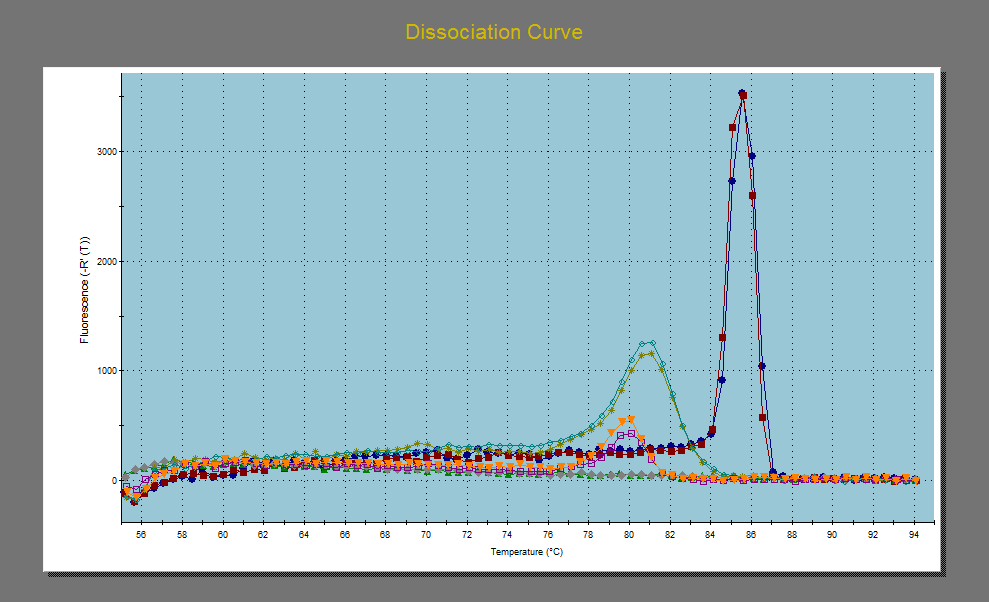
Dissociation curve of my data. Red and blue are the duplicates of my cDNA for the actin gene, green and pea green are the duplicates of my cDNA for the c-jun gene. The pink and yellow are the negative controls for the the actin gene.
One thing we did not do was to run an RNA control to assess if we have gDNA contamination. I'm guessing we do...or at least I have never been able to get away without DNasing my RNA. There are a few ways to assess whether you have gDNA contamination. First, you can design your primers so they span an intron-exon boundary. The genomic DNA should be much larger in size, as it contains introns, so you will have a higher melting temp, or you can simply run a standard PCR and look at the product size on the gel. You can also simply run an RNA sample on your qPCR. If there is no genomic DNA contamination, you should get no amplification. If there is contamination, you will get a product. Its best to run the RNA sample via qPCR because the limit of detection is much higher with qPCR and you may be able to pick up DNA contamination that you may not be able to see with standard PCR. Unfortunately, I always have so much gDNA contamination in my anemone RNA samples that I can pick it up with a standard PCR. Grrrr
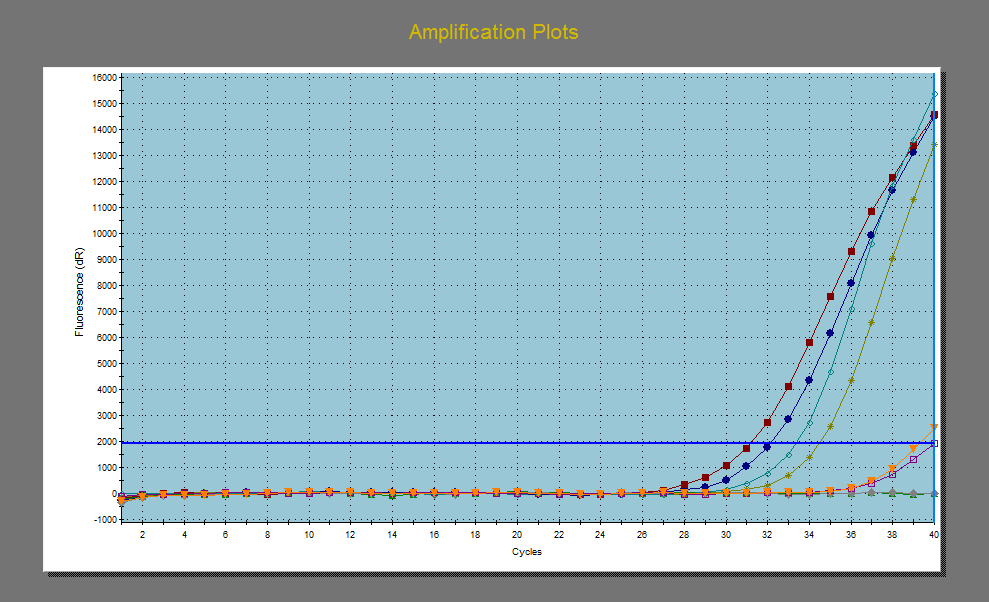
Applification plot of my cDNA data. Not so good replication between duplicates. Red and blue are actin, green and pea green are c-jun.
Data was analyzed using the following equation: 106(-(0.3012 *CT) + 11.434). I'm still a bit confused where this equation comes from, but I think it represents a reaction with an efficiency of 100%. This equation is used to calculate an arbitrary expression number for the Ct values for each reaction separately. Then the average arbitrary expression value for each gene was calculated (i.e. duplicates were averaged for each gene). Next, the data is normalized by dividing the arbitrary expression value of the gene of interest by the arbitrary expression value of the reference gene. Then we averaged this normalized value across healthy and infected individuals and compared the normalized arbitrary expression value of infected and healthy individuals using a simple t-test. The results suggest that jun C was expressed higher in the infected individuals, although this difference was not significant. Given the amount of contamination in the negative controls, and the fact that we didn't test for gDNA contamination, there results are probably not valid. However, it would be interesting to test for gDNA and re-run these samples in the molecular lab to see if they hold true.

It is also possible to analyze the data using the equation: R0= 1/((1+AER)^Ct), where AER is the average of efficiency of your reaction, a parameter that is given to you by the machine. Rnxs with efficiencies less than 95% should be re-run. This is the equation that the site "Miner" uses, which is web-based and free! You just need to put in your raw data.
7.25.10
Intertidal fun
Today I explored the intertidal zone during low tide to visit my old friends. Diversity of both algae and invertebrates seemed a bit lower here than I was expecting, most likely because the intertidal sites near the marine station are protected, as opposed to being exposed. The biggest waves I encountered were from boats!
Eel grass isolation
I also checked the status of the isolation streaking that Kathy performed on the bacteria growth that surrounded the small pieces of Eel grass that we plated on 7.23. For both the TCBS and the marine agar, growth only occurred for 2 out of the 4 streaks. The colonies on the TCBS turned yellow, indicating that the bacteria can ferment sucrose
.
7.26.10
ISH
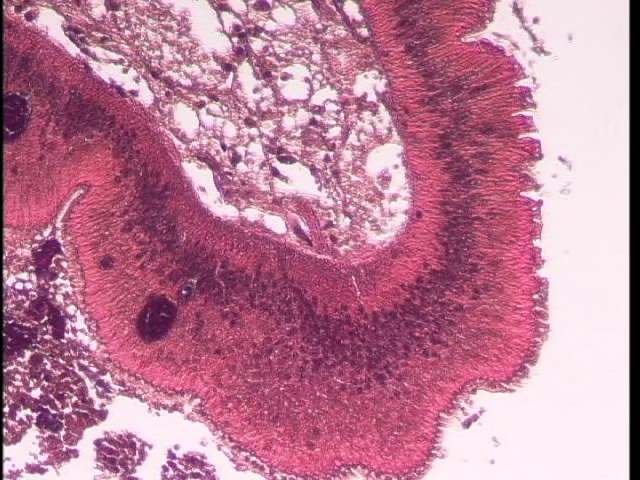
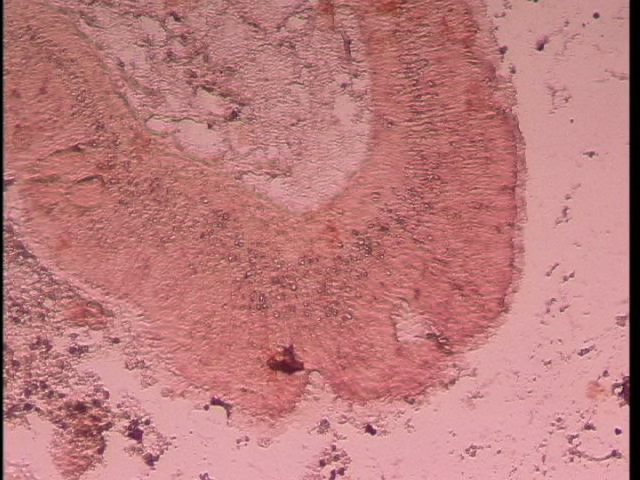
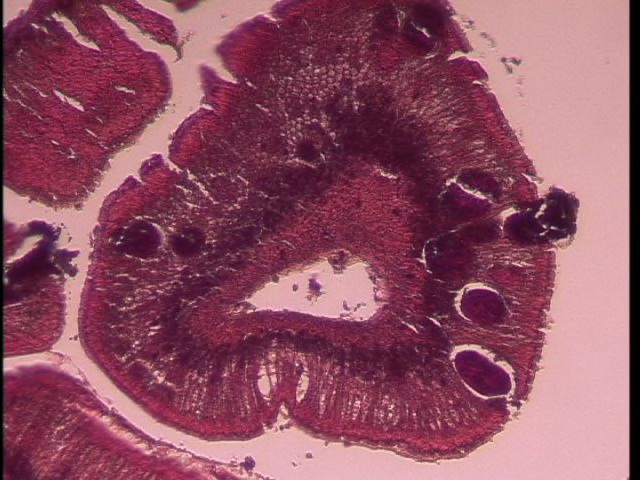
Today we began our in situ hybridizations. Lisa was awesome enough to make the probe yesterday, which involves PCR amplification of a specific DNA sequence from the ‘classic’ Ricketsia that causes wasting syndrome in abalone. After PCR amplification of the cloned product, the probe is labeled with a dye so that visualize of the probe is possible. The purpose of this in situ hybridization is to see if the probe for the classic Ricketsia anneals to the ‘stifled’ or ‘new’ Ricketsia that Lisa has identified with histology. This will help to determine if the ‘new’ Ricketsia are simply ‘classic’ Ricketsia that enlarged due to infection with virus-like particles. Today we performed the following steps according to the protocol on the Wiki:
- Removed wax from tissue
- Rehydrated tissue
- Prepared the tissue for hybridization
- Hybridzed the tissue with the probe
7.27.10
ISH Day 2
Today we continued with the ISH process by performing the following steps:
- stringency washing
- equilibrating tissue
- Blocking tissue
- incubating in anti-DIGG antibody conjugate
- incubating in dye
Heat Shock set up for protein extractions
This evening I also set up a water bath to heat shock some Anthopleura elegantissima so that we can extract proteins and perform western blots looking at Hsp70 expression. Drew collected 5 of the anemones this morning in False Bay. I'm not sure where the 6th anemone was collected, but it has been in the tanks since our arrival. Half of the anemones will be kept at control conditions (~13 degrees C), while the other half will be exposed to 25 degrees C for 8 hours.
7.28.10
Heat shock set up
This morning I came in at 7:45 to check on the temperature of the water bath. The water temperature had fallen to 20 degrees, or about room temp, so I think the heater turned off. Therefore, I cranked up the heat to ~30 and the anemones were exposed to this temperature for about 3 hours.
ISH
Today we finished up the ISH. We were very happy because the tissue had absorbed the dye after an over-night incubation. We then performed the following steps:
- slides were dipped with times in ddH20
- tissue was counter stained with Bismark brown
- slides were rinsed with ddH20, 70% EtOH, and 100% EtOH
- slides were allowed to dry
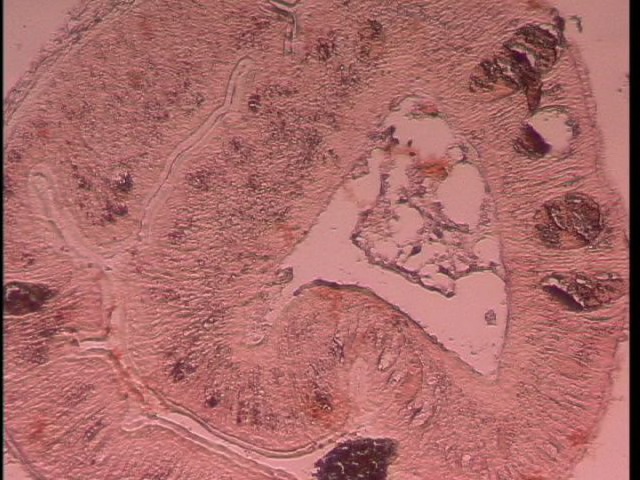
Protein extractions
We extracted proteins using the Sigma-Aldrich CelLytic tissue lysis/extraction buffer with an added protease inhibitor cocktail. Anemones were cut into fourths and one section was randomly selected for extraction. Tissue was dabbed with a kimwipe and weighed. Both the tissue samples Lisa and I used weighed 0.04 grams. Tissued was minced with a razor blade before 500 ul of reagent was added. Then a disposable pestle was used to homogenize the tissue. Another 500 ul of reagent was added since we used twice as much tissue as recommended. The tube was then spun at 4 degrees for 10 minutes at max speed and was stored in the frige during lunch. After lunch we added 50 ul of our protein extract to 50 ul of loading/reducing buffer. The sample was boiled for 5 minutes. This step denatures the proteins so that they can be run on a gel. The gel rig was assembled, the samples were loaded, and the gel was run at 150 V for 45 minutes. Gels were removed from the cassetts and the top of the gel was cut off. One of the gels was notched to keep track of the which gel was which. The gel was stained with Comassie Stain and was shaken for 5 minutes. The gel was then rinsed and destained in 10% acetic acid overnight.
7.29.10
Gel staining
Our gels stained nicely. Surprisingly, most of our protein concentrations seemed fairly consistent. The 30 ul of protein extract looked the best. We ran another gel this so that we could run a Western blot and most of us loaded 30ul and 20 ul, while Sarah and Matt diluted their sample to add the equivalent of about 5 ul, since their samples was highly concentrated. We then transferred the gel to the nitrocellulose membrane and began a Western blot according to the Invitrogen kit and using an antibody for Hsp70. Unfortunately, we did not get any bands to show up. The first trouble-shooting step we will take is to stain the membrane with Ponceau to confirm that our transfer worked. If protein is present, we will re-run a gel tomorrow using protein extracted from oyster gills, for which this protocol has worked in the past.
Oyster dissections
We also dissected oyster to look for Bonamia in Ostrea edulis. To open an oyster, you can insert a butter knife through the valve and wiggle it around until you can get it inserted cleanly. Then move the knife toward the flat side of the shell as close to the top as possible to cut the adductor mussel without penetrating the pericardial cavity. We then withdrew hemolymph by inserting a syringe into the pericardial cavity and slowly sucking up the hemolymph. The hemolymph can be dropped onto a slide and allowed to sit for a few minutes. You can also smear the hemolymph on a slide using another slide. We also extracted the heart, dabbed it with a kimwipe, and then dabbed the heart quickly on a slide. The cells can be set by putting them in methanol for 1 minute and then stained by putting them in giemsa stain for a few minutes. Then rinse with water and allow to dry.
We were able to identify hemocytes and they all appeared to be normal...no examples of Bonamia were found. However, we still have about a dozen oysters that can be dissected tomorrow to try to find the parasite.
7.30.10
Dr. Steven Robert's gel
Dr. Steven Robert's extracted protein last night from oyster gill, a crab, and a littorine. He then ran a gel loading 50 ul of the denatured protein in the gel. He then transferred the protein to a membrane and ran a Western. Only the oyster gill produced a band. He then stained the membrane with Ponceau S and multiple bands showed up. Therefore, either the transfer did not work yesterday, or we did not load enough protein.
Computer lab
After lecture we headed to the computer lab to discuss Quiz 1 and to talk about designing primers, etc. Kathy and I began doing a literature search for primers for broad scale taxonomic bacterial groups for our project.
Mopalia
Today we went Argyle creek to collect Mopalia (chitons) that potentially have some sort of disease. People at FHL have been noticing that mopalia have been detaching from the rocks, similar behavior to abalone with withering syndrome . We collected chitons that came off the rock very easily or that were not attached to rocks at all. First we would poke the chiton to give it a chance to react, and if was still able to detach from the rock very easily, we would collect the chiton. We assumed that healthy chitons attached to the rock more forcefully after being poked. We brought the chitons back to the lab and put them in the tanks.
Gel take 2
Today we repeated the process by extracting protein from the tentacles of A. elegantissima, the acontia of Mitridium, and a barnacle. We ran a gel and also used the oyster protein from yesterday as a positive control.
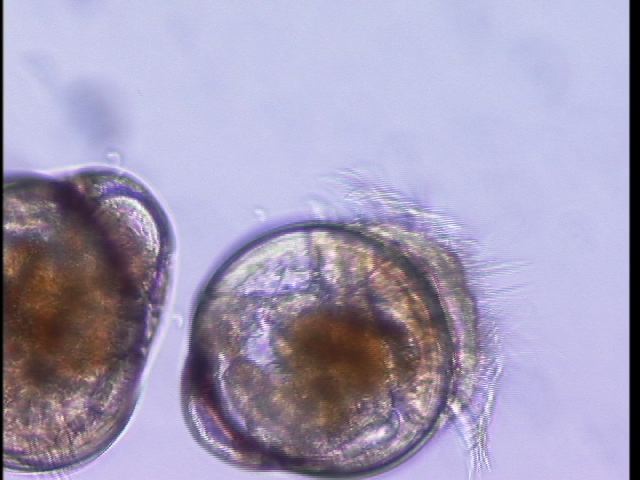
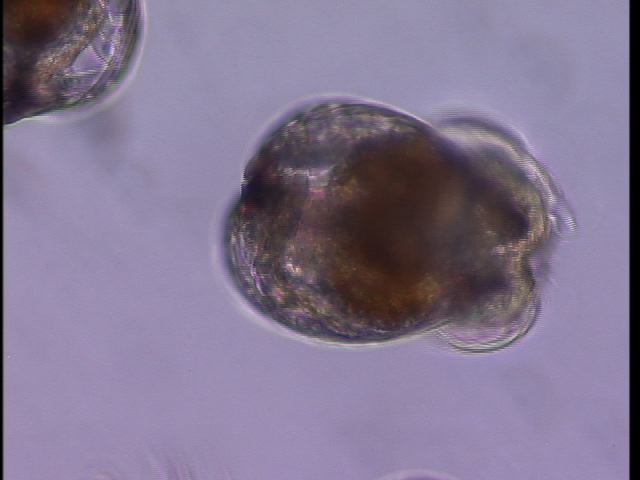
Oyster larvae
Our oyster larvae arrived today (Crassostrea gigas). Emma was wonderful enough to aliquot them into chambers for our experiment next week. But first, we put a few on a slide to see how cute they are. This is them at 20X.
7.31.10
Today we did the prep work for an inoculation experiment to test the best concentration of V. tubiashi needed to elicit a response in oyster larvae without killing them all. Kathy and I made up 3 liters of marine broth and inoculated two of the liters using 3 colonies of Vt. Emma got the larval system set up and taught people how to do water changes.
We also did some experimentation regarding anemone mucus. Kathy and I swabbed 5 anemones and plated the swabs on marine agar. For two of the anemones, we did not rinse the anemones first in FASW (anemones 1-2). For anemones 3-5, we first rinsed the anemones in FASW, and then swabbed the anemones. We swabbed the oral disc and tentacle crown if possible, but usually the anemones closed up rather quickly and so we would also swab the column. We did two swabs per anemones, one to plate with, and another swab for DNA extractions to test the Qiagen Stool kit. We also saved the tubes that the anemones were collected in so that we could try to spin them down and concentrate the mucus.
8.1.10
Today we plated the overnight cultures of the Vt to try to get an idea of the concentration. I plated 10-3 to 10-8 dilutions. I performed a serial dilution by adding 30 ul of ON culture to 270 ul of sterile marine broth (10-1). I then performed a serial dilution to get 10-3 to 10-8 and plated 100 ul on each plate, plating duplicates for each dilution.
We also checked our anemone plates. One plate had a great deal of growth, while the other four plates had a few small colonies just starting to take off.
8.2.10
VT Plates
Today Kathy and I counted colonies on the plates of the diluted Vt. 10-3 and 10-4 were too numerous to count. The average CFUs were 1052, 155, 21, and 2 for 10-5, 10-6, 10-7, and 10-8, respectively. Using the following equation, I calculated CFU/ml for the ON culture:
CFU/ml= CFU * dilution factor*plate dilution CFU/ml=155 * 10^6* 10= 1.55 x 10^9 CFU/ml. In order words, gross. Emma and a group of people changed the water in the larval chambers and collected larvae. We will continue to collect larvae every 24 hours for a few days. Collected larvae are dyed with Neutral red to determine if the larvae are still alive. Neutral red will only enter live tissue. Emma is also collecting larvae for RNA extractions.
Matt, Kathy, and I ran a PCR of the DNA extracted from anemone mucus to see if we could amplify bacterial DNA from our sample. We used the 27F 1492R universal primers for bacteria and the thermo-cycler program used previously in class.
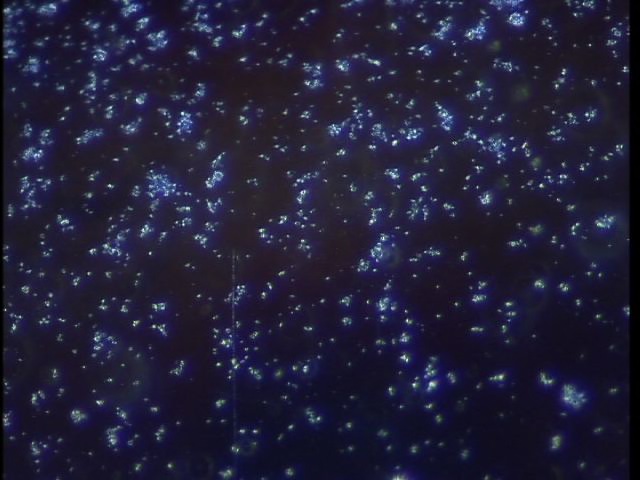
We also did an agglutination assay. This assay is used to determine if a sample is infected with Vt. The antibody is specific for Vt and will bind to the bacteria, causing the bacteria to clump. We used Vt in culture to run the assay, but normally you would not know if you had Vt and could use this assay to determine the bacterial culprit that is infecting shellfish in a hatchery. We put two samples on depression slides, one was Vt in seawater with no antibody (control) and the other sample was Vt in seawater with antibody. Vibrio is pretty clumpy anyway, but it was very obvious that the sample with the antibody was highly clumpy.
.
Control
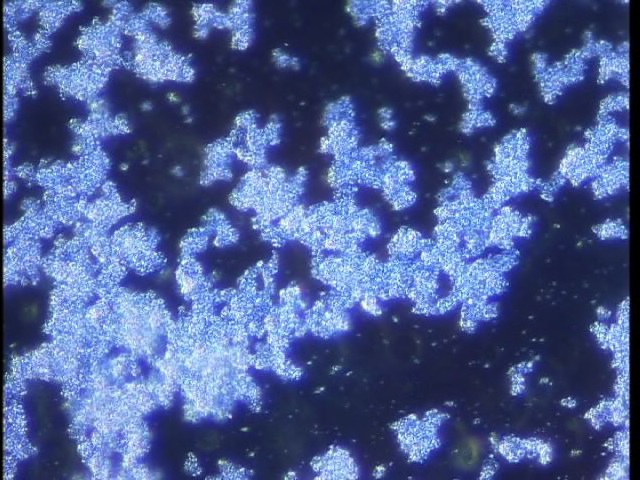
Antibody
8.3.10
Oyster and Vt
Today Lisa and I helped Emma change the water and sample larvae for her experiment. First, ten mls was sampled from each larval container to collect larva to view under the microscope to asses conditions. We then strained the water from each larval container through a fine mesh to collect the larvae while dumping the water. We used a disposable pipette to sample ~1000 larvae for RNA extractions that were put in RNAlater. Then the larval containers and rinsed and refilled with filtered seawater. Today was 48 hours post-vt exposure. All of the larvae sampled from the 10^-1 and 10^-3 bacterial dilutions were dead (corresponding roughly to 1.55X 10^8 and 1.55 X10^6 CFU/ml). I'm not sure how the larvae from the 10^-5 dilutions (~1.55 X 10^4 CFU/ml) faired. The results of this preliminary exposure experiment will dictate the bacterial concentration that Emma uses for her experiment looking at the effects of pH on disease dynamics.
A. elegantissima surface microbial assemblages
Kathy, Matt, and I check the gel of our PCR from yesterday and we had amplification in our template negative control, and one of our extraction negative controls. This implies that the contamination is not in the master mix, since we had one extraction negative control that indeed turned up negative. We ran another PCR after switching to a sterile box of tips.
Matt also played around with eliciting mucus release from anemone. He put some anemones in DI water and this caused a small release of mucus. We tried to spin it down but there was still no pellet to be seen. He also tried suspending an anemone over a mesh net and allowing the mucus to drain through, but this did not seem to work either.
We also scanned the literature for our taxon-specific primers to use for qPCR. We found primers for all of our taxa of interest.
Sea fan Differential Display (DD)
We also received sea fan cDNA in the mail today from Colleen. She did all of the hard work, but we did the last steps of DD, namely a PCR using random primers, to see if we could amplify a product and to determine if that product was differentially expressed between treatments (control, injected with SPX, or injected with Aspergillus). The cDNA is from multiple pooled individuals for each treatment, but I'm not sure which time point post-injection was used (Colleen took samples 24 hours post-injection and a few days post-injection). The class worked in two groups, using two different primer sets, set 19 and set ? We also ran two negative controls per PCR.
8.4.10
A.e SM
This morning we checked our gel and had no product. WTF? We used the thermocycler in lab 10, and we UV treated our master mix (sans primers) in hopes that it would help with the contamination. However, this meant adding the primer to individual tubes in small amounts, which could lead to error. I also checked the thermocycler program to make sure I hadn't mis-entered a step, but the program was correct. I ran another PCR this afternoon, where I did not UV treat the master mix (primers were added to MM) and I did not add the cDNA on the thermocycler for the hot start. We got product this time, but we also had bands in all of our negative controls. Boo. It should be noted that for most of our samples (4/5), the bands are at much greater intensity than for the negative controls, suggesting that we successfully extracting microbial DNA from the mucus using the Stool kit. Tomorrow we will repeat the PCR with new water and with new working solutions of our primers, as we realized the entire class dipped into these primers when we amplified microbial DNA from the snails. We will also use the sterile hood on the bottom level of lab 10. We may also try to quantify our DNA with PicoGreen and the qPCR machine.
Matt was able to successfully collect mucus from anemones today using the mesh method. He plated and streaked mucus on TCBS and marine agar. We then UV sterilized the plates for 10 minutes. We are testing to ensure that UV treatment will kill the bacteria. If so, we can plate bacterial isolates on mucus-treated plates to see if the mucus exhibits antibacterial properties.
Today we also decided to radically revise our methods for the project. After communicating with Ian Hewson, marine microbiologist extraordinaire, he suggested that the qPCR using taxon-specific primers would be difficult (crap) and meaningless without a standard curve. And you can't really make a universal standard curve. He suggested that we use FISH instead, which could give us both presence and abundance of certain bacterial taxa. Today we searched the literature for taxon-specific probes that could be used for FISH and we found them for all of our taxa of interest. We are in the process of communicating with various labs to make sure we can use a fluorescent and/or confocal microscope. We also sent a budget to Drew.
Sea fan DD
We also rand the gel for the DD this morning. The good was that all of the negative controls were blank. Yay! Primer set 19 amplified a bright band, but it was not differentially expressed across treatments. There were a few faint bands that were amplified by the other primer set that seem to be differentially expressed across treatments. Steven cut these bands out of the gel so that they could be purified and sequenced. The photo of the gel is on the main page of the Wiki.
8.510
Today we checked for bacterial growth on our mucus-treated plates and there was none. Therefore, the UV treatment for 10 minutes was sufficient to kill any bacteria in the mucus. Matt then plated a few colonies of bacteria previously isolated from anemone swabs on our mucus-treated plates, as well as control plates. Tomorrow we will compare the growth between control and mucus-treated plates to see if the mucus has any antibiotic properties.
Today we did communicated with Koty Sharp, a friend of Kathy's who is also a FISH expert. She gave us the ins and outs of negative and positive controls, as well as probes and dyes. We learned that its good to have a universal bacteria probes as a positive control. Its also good to have a negative control that doesn't match to bacteria that is labeled to ensure non-specific binding is not an issue. In addition, because probes for gamma proteobacteria tend to bind to beta-proteobacteria as well, Koty recommended that we use a non-labeled probe for beta-proteobacteria when hybridizing for gamma proteobacteria to ensure specificity and non-specific binding. This being the case, these are the probes we would like to purchase:
Universal (EUB338; labeled)
neg cont (EUBNON; labeled)
Gamma-proteobacteria (Gam42a;labeled)
Alpha-proteobacteria (ALF968; labeled)
Beta-proteobacteria (Bet42a; non-labeled)
We decided to start slow and we ordered just the positive control (EUB338) labeled with Cy5. We also learned from Koty that we need to use HPLC quality probes, which are more expensive. We ordered from Operon/Eurofin/MWG Biotech because they were a bit cheaper than IDT. We also ordered a DNA extraction kit.
We were also trained on the confocal in lab 8. Its a pretty old machine with an even older operating systems, but it seems to work fine. Unfortunately, we learned that Cy5 may not work with the confocal, because the laser is old, and the red is the first to go. So we may have just spent $100 for nothing. Boo. I tried to cancel the order, but it had already gone through. The confocal might be over kill for our intent and purposes anyway. We may just be able to get away with an epifluorescent scope.
8.6.10
Today we met with Carolyn to talk about FISH. She agreed that we should start with one probe at a time. We talked about filtering and fixation practices. It was decided that fixing in 10% formalin (which we have here) in FSW would work equally as well as 4% paraformaldehyde (which we would have to order). We decided it would be best to fix the filter after filtrating the mucus from the swab in a small volume of seawater rather than putting the swab directly into a fixative. We can then put the filter on a small volume of formalin and fix the cells that way. We can then wash in PBS and proceed according to Koty's protocol.
Our plan was to do a dilution serious of a mucus swab to determine what would be the best dilution so that we can adequately count cells. We will test this by using a nucleic acid-staining dye like SYBR green, SYBR gold, or EtBr.
Then we spent way too much time collecting items needed to filter water/mucus for our project. First we had to track down a working vacuum pump, then a filter apparatus that would actually work for the size filters we needed, then we needed formalin, then we needing tubing that wouldn't collapse, etc.
In the meantime, Matt swabbed an anemone with a sterile cotton tipped applicator and put the swab in 100 ul of FSW. He then made a 10^-1 and a 10^-2 dilution of the swab/FSW mixture. Once we were able to finally get a filtration apparatus up and running, we added 100 more ul to each vial and filtered that onto a 0.2um filter. We have 3 filters with full strength mucus/FSW mixture, and 10^-1 and 10^-2 dilutions. We then fixed the filters by floating them on 300ul of 10% formalin in FSW in a petri dish. The petri dish was then parafilmed and place in the frige ON. 300 ul might be too much liquid, and 200ul might work better.
We checked the plates from yesterday and I think we had a communication breakdown. Bacteria didn't get streaked on the control plates, so we couldn't compare bacterial growth between mucus-treated and non-mucus treated plates. However, bacteria did grow on the mucus-treated plates. We can re-do this experiment once we get some more anemones.
We also talked with Drew and Steven and they thought we should also order primers for qPCR, or original plan, so that in case we can't get the FISH to work, we can still generate some data. We did a lit search to find primers for the remaining taxa we were missing, and submitted a list of primers to order to Lisa. These primers included those for:
alpha-proteobacteria
gamma-proteobacteria
Vibrio
Actinobacteria
cyanobacteria
universal
Karen Chan suggested that we check with labs at UW to see if they have FISH probes they would be willing to share since we only need a small aliquot. We sent her an email with the specs and she composed an email to a few labs to see if they would be willing to share.
Here are the dyes/excitation wavelegths that are compatible with the epifluorescent scope here:
FITC/HYQ/ALEXA-488 (Excitation 460-500)
DAPI/ALEXA-420 (Excitation (400-418)
G-2E/G-TRITC (Excitation 528-553)
8.7.10
In the morning I worked on my quiz. We also rinsed our filters that had been fixing overnight in formalin by putting them on the filtration apparatus and filtering 500 ul of PBS over the filter. We then removed the filters and floated them on a 1:25,000 dilution of EtBr. I have no idea what the EtBr stock concentration is, so I'm not sure what concentration of EtBr we actually used. Lastly, we rinsed the filter in PBS. Carolyn showed us how to use the epifluorescent scope in Fermald Hall. We put the filter on a slide and put a cover slip over the filter. We were able to see fluorescence, but the objects that fluoresced were too large to be bacterial cells. And they seemed to be floating, which didn't make sense, since the filters were fairly dry. I suspected that the fluorescence might actually be coming from the immersion oil, so I placed some oil on a cover slip on a blank slide, and there was still the weird fluorescent blobs, so the oil is contaminated with something that fluoresces. When trying to view the filter on a slide with no oil, we were unable to pick up any fluorescence. Either we have no bacteria on the filter, or our EtBr didn't work. I think the latter is the case, as Kathy's protocol for staining cells with SYBR gold calls for a 1:5000 dilution, and we used a 1:25000 dilution. I swabbed another anemone with two applicators and put them in 200ul of FSW. I think filtered the mixture and fixed the cells on the filter. Tomorrow we can use a higher concentration of EtBr and/or can test if there is a difference between drying the membrane after fixation to allow the cells to adhere to the filter better or not drying. Originally we thought the floating fluorescent blobs were from the filter, and we thought we needed a better way to get the cells to adhere to the filter. But as this was not the case, our cells might be sticking just fine. It might be best to use two different concentrations of EtBr instead. I also tried to do a gram stain on the filters from today to see if we could determine if any bacteria were present on the filter, but this did not work, as the filters were to porous and sucked up crazy amounts of dye, and the destaining solution pretty much dissolved the filter. Boo.
8.8.10
Today we went in the field to collect anemones. We went to Cattle Point; not the bench we went the first time, but rather a bench about 1/8 of a mile to the east because it sloped more gently towards the water. We began collecting anemones at ~10:30 am. Kathy, Russell, and I went down as low as we could go where there were still clusters of anemones. The tide was -2.19, so I'm guessing we were at about -1.5. The weather was warm and sunny...I plan to get air/water temps from the weather station. We collected 15 anemones by prying them off the rock with a metal spatula. We then rinsed with filtered sea water (FSW) and put each anemone into a sterile falcon tube with 25 ml of FSW. We also collected some big fatty anemones for mucus collection that we put in plastic bags. Back at the lab, we put the anemones into weigh boats. We then swabbed each anemone with a sterile cotton applicator for the following purposes:
- FISH (applicator placed in 200 ul FSW)
- DNA extractions (applicator placed in 1000 ul of extraction buffer)
- TCBS plate
- Marine agar plate
Control A (for day 1 experiments; heat stress): L1, L9, L12
Control B (for day 2 experiments; heat stress+pathogen): L3, L6, L11
Heat: L2, L7, L13
Vt: L4, L8, L14 (L4 was dropped in flask with waste water)
Heat + Vt: L5, L10, L15 (L15 was dropped in flask with waste water)
The anemones for the experiment were placed in a dish, 3 per dish, with FSW, and were place in the tank so that they dishes were submerged in water, but that water was not spilling into the dishes. The anemones for mucus were also place in FSW on a raised platform.
At ~3:00, we returned to the field and began collected anemones from the high zone. We collected just as the water was beginning to fill very shallow tide pools, but the water previously in the pools was very warm ~(28). We then returned to the lab and repeated the swabs for 12 high anemones. We are only using low anemones for the experiment, as we feel anemones in the low zone would show the greatest response to temperature stress. We did, however, also collect some fatties for mucus, which were placed in FSW.
8.9.10
Today we tortured some anemones with heat stress. The FWS was changed in the Control 1 and Heat dish and then the heat dish was placed in a water bath at 35 degrees for 3 hours. After 3 hours, the anemones were swabbed for FISH and DNA. However, this was only done for the HS anemones, as we forgot to also do it for the control. We did do the controls, but at ~6:30 at night, when we realized we hadn't done it. Rad. We also collected mucus from 5 low and 5 high zone anemones. We cut some mesh and sterilized it in a 10% bleach bath, a sterile water bath, and finally a 70% EtOH bath. We placed the anemones on the mesh and waited for the mucus to come pouring off. Unfortunately, this wasn't the case, and the anemones mostly lost water. So then we ringed out the anemones (really) and then perturbed them until then started producing some mucus, which was sucked up by a disposable pipette into a 1.5 ml tube. We pooled mucus samples from the individuals by treatment (i.e. low and high). The mucus was the stored in the frige.
We checked out plates from the swabs from yesterday and we appear to have growth on most plates. Interestingly, there appear to be more Vibrios on anemones from the low zone, as 2/5 plates from the high zone exhibited no growth on TCBS plates, while all 5 plates from the low zone exhibited growth. The colonies of Vibrio on the TCBS plates also differ in morphology, with the colonies on plates from the low zone having very large colonies. We put plates with lots of growth in the frige, but allowed pates with no or little growth to remain at rm temp ON again.
We also made ON cultures of 3 bacteria to be plated onto mucus and control plates tomorrow. We decided to use Vt, as we know the identity of this bacteria. We also chose to grow up an unidentified Vibrio from a TCBS plate and a unidentified bacterium from a marine agar plate. Both of these colonies were from anemone one in the low zone (L1).
On the filter front, for the filters prepared on 8.7.10, I rinsed one 3X with PBS (by filtering 500 ul over the membrane) and allowed it to dry. For the other filter, I did not filter with PBS, but allowed it to dry after removing from formalin. Lastly, I filtered 1000ul of an Vt broth over a filter as a positive control for bacteria (the filter was also fixed in 10% formalin for ~6 hours and was then rinsed 3X in PBS before allowing to dry). We were going to try to visualize the filters today using EtBr, but alas, we are out of EtBr. Our extraction kit came in today, so tomorrow we will start DNA extractions.
8.10.10
Today we extracted all our DNA like molecular banshees. We first extracted all of the samples from the low zone, with Kathy and I splitting up the 16 samples into 8 each. We only used 1/3 of a tablet per extraction, which meant that we were able to pull more than 200ul of supernatant off following the pelleting of the tablet. We wanted to add an equivalent amount buffer AL, but we knew we wouldn't have enough to go around, so we added the prescribed 200ul. However, we did add 300 ul of EtOH rather than 200ul. After lunch, we extracted the anemones from the high zone, as well as the experimental anemones, and the seawater samples. We did an extraction control for the old buffer that was used for the environmental anemones, and an extraction control for the buffer that was used for the experimental anemones.
Today we also plated mucus on marine agar. Six plates will were plated per bacterial species; two control, and four with mucus (two from high intertidal anemones, and two from low intertidal anemones). We then UV treated the plates for 10 minutes. Strangely, the plates would not dry, the mucus was still streaming over the plates a few hours later. We decided to plate our ON cultures of bacteria on non-treated plates to ensure we could plate the bacteria and that our concentrations would be countable. We plated a 10^-5 dilution. The plated bacteria (100) would also not dry. We think something is wrong with the plates.
8.11.10
Today pretty much sucked. Everything we tried failed. First, the plated mucus was still not dry, nor were the plates that had been plated with the overnight culture of bacteria. We think there is definitely something wrong with the plates. Lisa has kindly agreed to make some more, as I must have done something terribly wrong last time. As our ON cultures are pretty much spent, we started some new cultures with the same bacteria (Vt, unknown Vibrio, and unkonwn bacterium).
We wanted to try to quantify our DNA using the PicoGreen kit and the qPCR machine. We have 46 samples total, but we decided to just run a subset to test the protocol. We ran a sample each from the high intertidal, low intertidal, seawater, control, heat shock, Vt, heat shock + Vt, and both extraction controls. We used a hybrid protocol of the Freidman lab and the Hewson lab. Here is our master mix:
To each well we we added:
14 ul TE Buffer
15 ul PicoGreen working stock (1:200 dilution of the stock)
1 ul DNA template and/or standards
On the qPCR we selected 'plate reader' and 'FAM' and 'pre-run.' We got some super weird numbers, so we tried a 'post-run' but we got essentially the same numbers. I'm not sure what they numbers mean, but they appeared to increase with the DNA concentration in our standard curve, so we graphed them against DNA concentration. The R squared was pretty crappy, but we used the equation of the line to calculate DNA concentrations, and got number ranging from negative concentrations to 13 ng/ul. We don't trust these results. We also realize that we are concentrating all DNA and not prokaryote DNA, which is what we are interested in. There is essentially no way to do this. There is probably host DNA and zoox DNA in the mucus, so even if you know your DNA concentration, you still don't have any idea about the concentration of bacterial DNA in the sample, and thus cannot compare across samples. We talked to Dr. Steven Roberts about this and he suggested that we standardize our samples using the arbitrary expression value that we get when we use the universal primer.
We also ran a preliminary qPCR on a subset of samples including L1 and L2, H1 and H2, SW1 and SW2, and neg extraction 1 and a no template control.
Here is the MM:
BSA 1.5
F primer 0.5 (10 uM working solution)
R primer 0.5
H20 8
2X Sybr 12.5
Here is the program:
95 for 7:00
95 for 0:10
55 for 0:30
72 for 0:30
melting curve
Our qPCR was a mess. We had contamination in our extraction control and contamination in 1 of our 2 no-template controls. The CT was very high, indication low DNA yield in the majority of our samples as well. This plate was not set up in the hood, which may have led to some contamination issues. We will try a standard PCR tomorrow to try to discern some of these problems.
8.12.10
Today we ran a conventional PCR to see if we could amplify bacterial DNA from our environmental samples using universal primers and to see if we could get negative extraction and no template controls if we used the hood. We ran L1-L15 and H1-H10. We ran out of MM and couldn't run H11 and H12, nor a NT control. We did run an extraction control from the old buffer. In order to save reagents, we used a rxn volume of 12.5 ul. The plate was set up in the hood and the PCR water and BSA were UV treated prior to use, as was the plate.
Here is the Master Mix:
BSA 0.75
F primer 0.25
R primer 0.25
H20 3
Go Taq 6.25
2 ul of template
We used the 16S program listed earlier in my notebook.
Yea! We actually got good results! We had no amplification in our extraction control and most of our samples had amplification. Intrestingly, all of the samples from anemones in the low zone showed amplification, where as only ~1/2 of the samples from anemones in the high zone showed amplification. This is consistent with our plates of anemone mucus, which showed that there was more growth on plates swabbed with anemone mucus from the low zone than the high zone. This is an interesting and exciting pattern and we will repeat the PCR tomorrow with qPCR
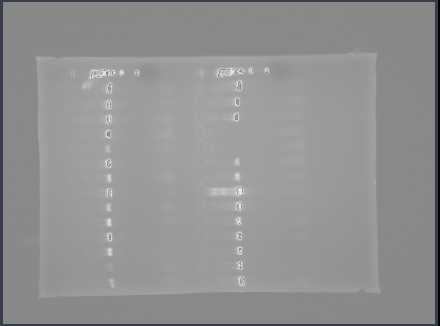
(See map for details)
Feeling good, we ran a qPCR to test our primers on our extraction controls to see if there was a certain bacteria that had contaminated our extraction controls (we started this qPCR before our previous results, suggesting we had no contamination). We run duplicates of both our extraction controls (old and new buffer) with a no template control and six 7 primer sets (alpha, gamma, acido, actino, vibrio, cyano, universal). We only ran a NT control for universal to save reagents. Unfortunately, we had amplification for all primer sets, accept actino, for which the primers did not work of there were no actino present. For most of the primers, the CTs were rather high, ~36-39. However, for cyano bacteria, the CT was ~26. WTF? Is it really possible that we have contamination from such varied bacterial groups? I set up the rxn in the hood, UV treated the water, BSA, and plate, and used all new SYBR mix. When I resuspended the primers, I used UV treated TE, did it it in the hood. Furthermore, for a few of the primers (including universal), we have multiple dissociation curves, suggesting major primer dimers, or non-specific amplification. But we only get one band when we run the universal primer amplification on a gel? Steven suggested this could be due to differential GC content between bacterial groups. Tomorrow we will run a qPCR using the universal primer and all of our environmental samples.
We also made various buffers for FISH in case we have time to test the Cy5 labeled universal primer, which came in a few days ago.